# Generating analysis results
Once you have finished your analysis, you can generate a report with the results.
You can do this in two ways:
- Generating a full report with all the widgets in the dashboard.
- Downloading an individual image from a widget.
# Generating a full report
Let's say you have built a dashboard with several widgets and you want to generate a report with all the widgets in the dashboard:
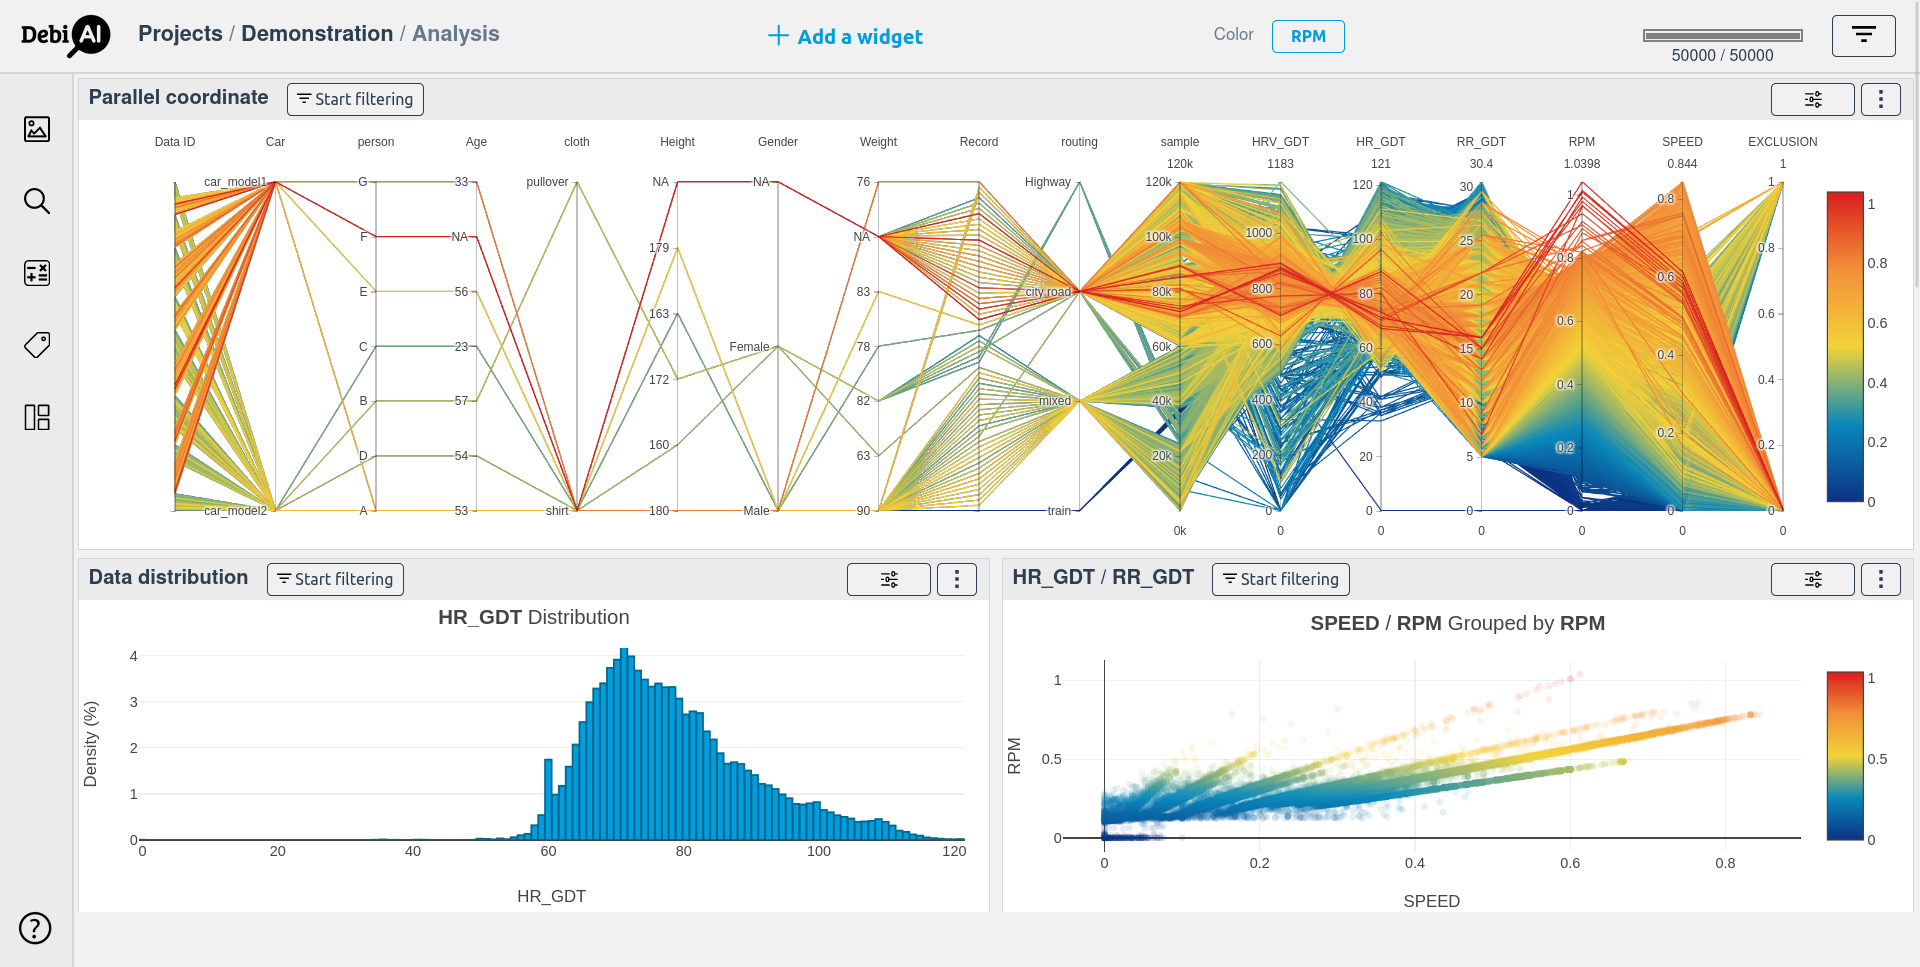
You can generate a full report by clicking on the "Generate report" button from the side menu:

This will generate a report with all the widgets in the dashboard and download it as a ZIP file, containing the following files:
Project_Analysis.zip
├── analysis.md
├── configurations
│   ├── 1_ParallelCoordinate_Parallel-coordinate.json
│   ├── 2_DistributionPlot_Data-distribution.json
│   └── 3_PointPlot_Point-plot.json
└── images
    ├── 1_ParallelCoordinate_Parallel-coordinate.jpeg
    ├── 2_DistributionPlot_Data-distribution.jpeg
    └── 3_PointPlot_Point-plot.jpeg
An analysis.md markdown file will be generated summarizing the analysis by listing all the widgets in the dashboard and their configurations.
Here is the markdown file generated from the dashboard above.
# Comments
The comments you have added to the widgets will be added to the markdown file.
More information about adding comments to widgets can be found here.
# Downloading individual images
You can also download individual images from a widget by clicking on the "Download image" button from the menu in the top right corner of the widget.
More information about downloading individual images can be found here.