DebiAI
Get Started
Demo (opens new window)
  • Woodscape
Contact
GitHub (opens new window)
DebiAI
Get Started
Demo (opens new window)
  • Woodscape
Contact
GitHub (opens new window)
Get Started
Demo (opens new window)
  • Woodscape
Contact
GitHub (opens new window)
  • Get started
    • Installation
  • Data insertion
    • Python module
    • Data providers
  • Custom algorithms
    • How to use algorithms
    • Integrated algorithms
    • Algo-providers
  • Dashboard
    • Widgets
      • Parallel coordinates
      • Data distribution
      • Point plot
      • 3D point plot
      • Confusion matrix
      • Correlation matrix
      • Interval plot
      • Parallel Categories
      • Range slider plot
      • Night stars plot
      • 2D density plot
      • Sample array
      • Statistics
    • Widget configurations
    • Saving layouts
    • Data export
    • Analysis export
    • Unfolding columns
  • Tutorials

    • WoodScape Tutorial

# 3D point plot

[Data overview] [Bias detection] [Outlier detection] [Model evaluation]

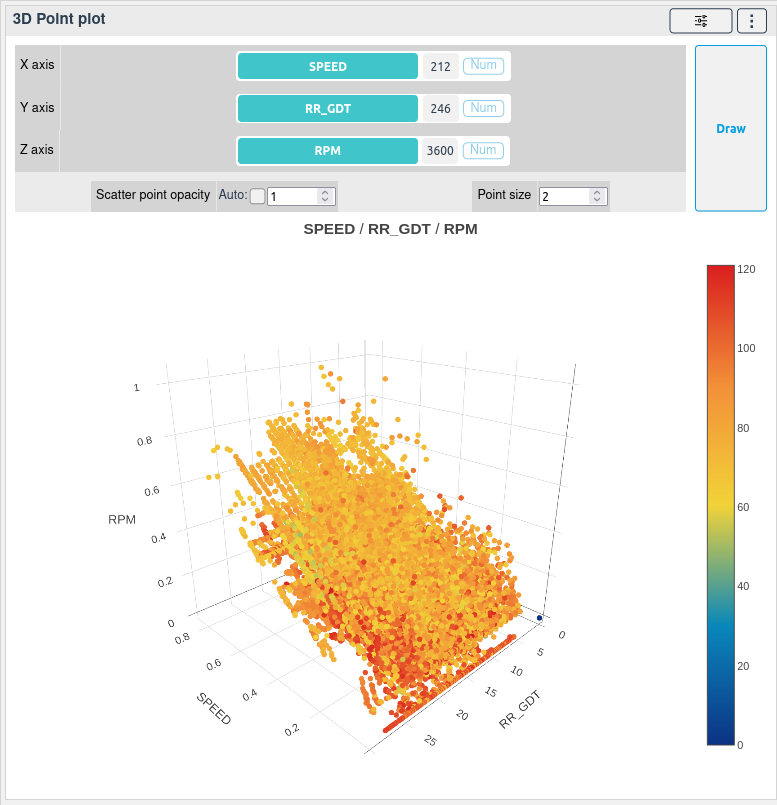
The 3D point plot widget shows the distribution of the data points in a 3D space. The widget can be used to detect anomalies in the data points.

The widget can also be used to compare the models error according to two different features.

Help us improve this page! (opens new window)

← Point plot Confusion matrix →

PARTNERS
IRT SystemX Confiance AI
  • Get Started
  • Demo
  • Tutorials
  • Woodscape
  • Contact
Legal notice - Personal data and cookies All rights reserved © 2020 IRT SystemX