DebiAI
Get Started
Demo (opens new window)
  • Woodscape
Contact
GitHub (opens new window)
DebiAI
Get Started
Demo (opens new window)
  • Woodscape
Contact
GitHub (opens new window)
Get Started
Demo (opens new window)
  • Woodscape
Contact
GitHub (opens new window)
  • Get started
    • Installation
  • Data insertion
    • Python module
    • Data providers
  • Custom algorithms
    • How to use algorithms
    • Integrated algorithms
    • Algo-providers
  • Dashboard
    • Widgets
      • Parallel coordinates
      • Data distribution
      • Point plot
      • 3D point plot
      • Confusion matrix
      • Correlation matrix
      • Interval plot
      • Parallel Categories
      • Range slider plot
      • Night stars plot
      • 2D density plot
      • Sample array
      • Statistics
    • Widget configurations
    • Saving layouts
    • Data export
    • Analysis export
    • Unfolding columns
  • Tutorials

    • WoodScape Tutorial

# Confusion matrix

[Model evaluation] [Classification]

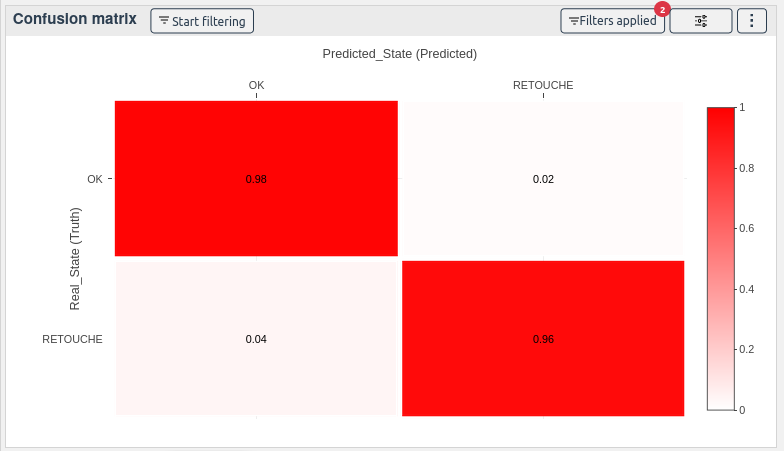
The confusion matrix widget is useful for classification problems. It shows the number of true positives, true negatives, false positives, and false negatives.

By selecting the models as color, you can display a confusion matrix for each model.

Help us improve this page! (opens new window)

← 3D point plot Correlation matrix →

PARTNERS
IRT SystemX Confiance AI
  • Get Started
  • Demo
  • Tutorials
  • Woodscape
  • Contact
Legal notice - Personal data and cookies All rights reserved © 2020 IRT SystemX