DebiAI
Get Started
Demo (opens new window)
  • Woodscape
Contact
GitHub (opens new window)
DebiAI
Get Started
Demo (opens new window)
  • Woodscape
Contact
GitHub (opens new window)
Get Started
Demo (opens new window)
  • Woodscape
Contact
GitHub (opens new window)
  • Get started
    • Installation
  • Data insertion
    • Python module
    • Data providers
  • Custom algorithms
    • How to use algorithms
    • Integrated algorithms
    • Algo-providers
  • Dashboard
    • Widgets
      • Parallel coordinates
      • Data distribution
      • Point plot
      • 3D point plot
      • Confusion matrix
      • Correlation matrix
      • Interval plot
      • Parallel Categories
      • Range slider plot
      • Night stars plot
      • 2D density plot
      • Sample array
      • Statistics
    • Widget configurations
    • Saving layouts
    • Data export
    • Analysis export
    • Unfolding columns
  • Tutorials

    • WoodScape Tutorial

# Correlation matrix

[Data overview] [Bias detection] [Model evaluation]

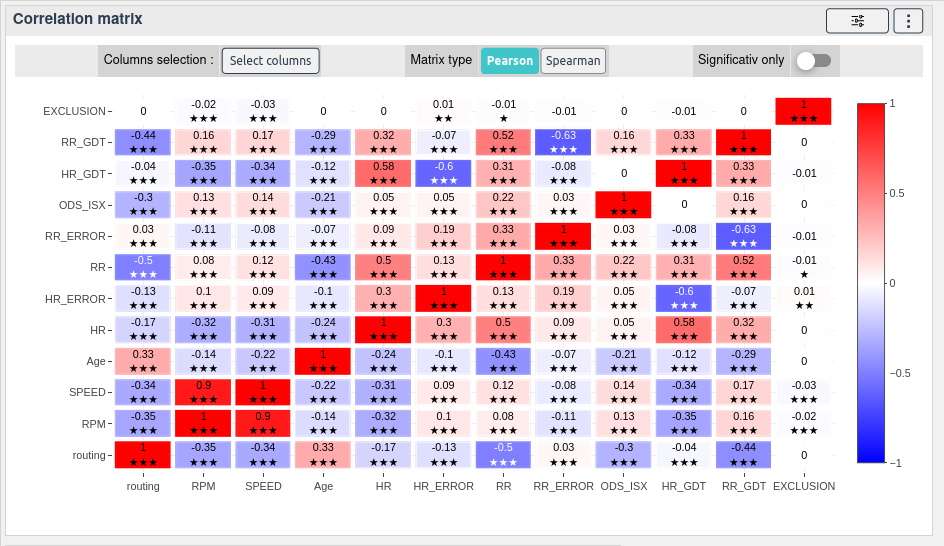
The correlation matrix widget shows the correlation between the features of the data set. The correlation is calculated using the Pearson correlation coefficient.

The widget also shows the p-value of the correlation. The p-value is the probability that the correlation is not significant.

Help us improve this page! (opens new window)

← Confusion matrix Interval plot →

PARTNERS
IRT SystemX Confiance AI
  • Get Started
  • Demo
  • Tutorials
  • Woodscape
  • Contact
Legal notice - Personal data and cookies All rights reserved © 2020 IRT SystemX