DebiAI
Get Started
Demo (opens new window)
  • Woodscape
Contact
GitHub (opens new window)
DebiAI
Get Started
Demo (opens new window)
  • Woodscape
Contact
GitHub (opens new window)
Get Started
Demo (opens new window)
  • Woodscape
Contact
GitHub (opens new window)
  • Get started
    • Installation
  • Data insertion
    • Python module
    • Data providers
  • Custom algorithms
    • How to use algorithms
    • Integrated algorithms
    • Algo-providers
  • Dashboard
    • Widgets
      • Parallel coordinates
      • Data distribution
      • Point plot
      • 3D point plot
      • Confusion matrix
      • Correlation matrix
      • Interval plot
      • Parallel Categories
      • Range slider plot
      • Night stars plot
      • 2D density plot
      • Sample array
      • Statistics
    • Widget configurations
    • Saving layouts
    • Data export
    • Analysis export
    • Unfolding columns
  • Tutorials

    • WoodScape Tutorial

# Interval plot

[Sample visualization] [Model evaluation] [Time series]

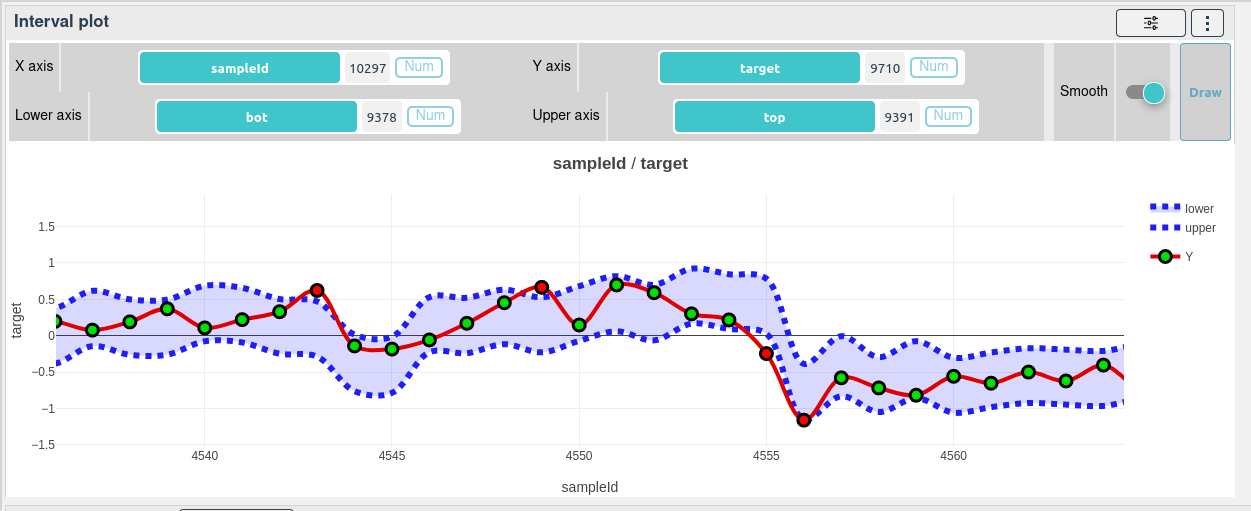
The interval plot can shows trust intervals for time series data.

Help us improve this page! (opens new window)

← Correlation matrix Parallel Categories →

PARTNERS
IRT SystemX Confiance AI
  • Get Started
  • Demo
  • Tutorials
  • Woodscape
  • Contact
Legal notice - Personal data and cookies All rights reserved © 2020 IRT SystemX