# Range slider plot
[Sample analysis]
[Outlier detection]
[Model evaluation]
[Time series]
[Data export]
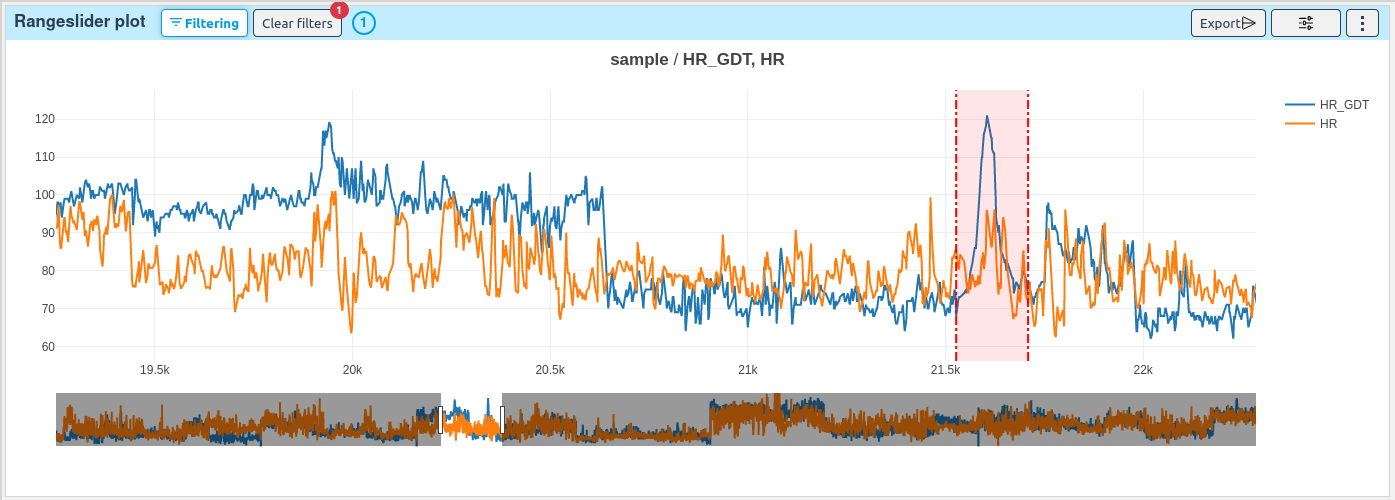
# How to select samples with a 1D range
To start filtering samples with the point plot, click on the Start filtering button.
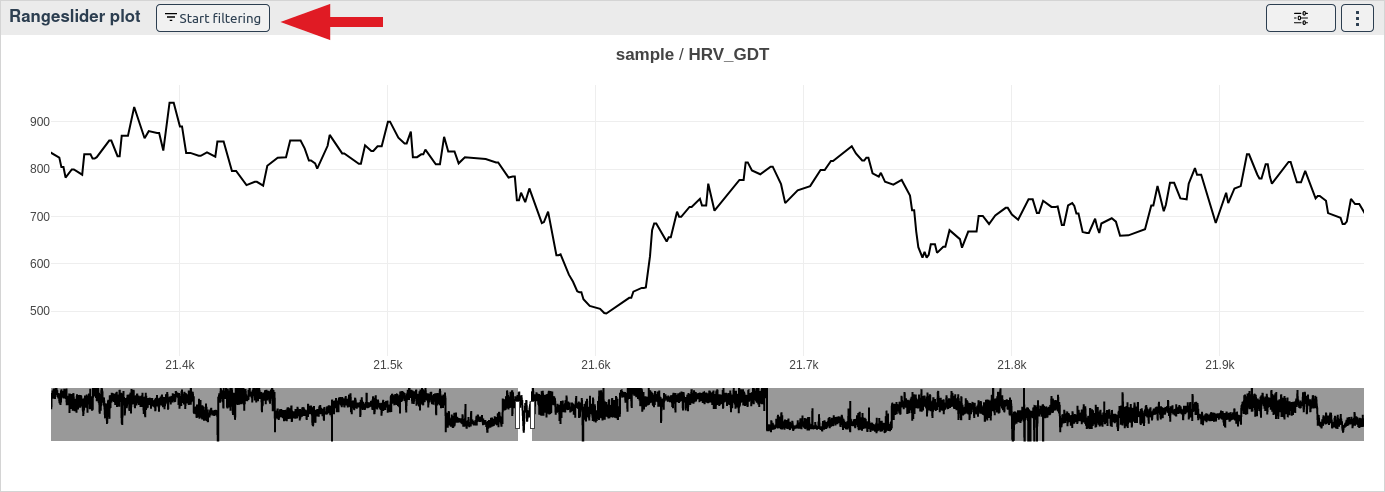
Then click on two different points on the plot.
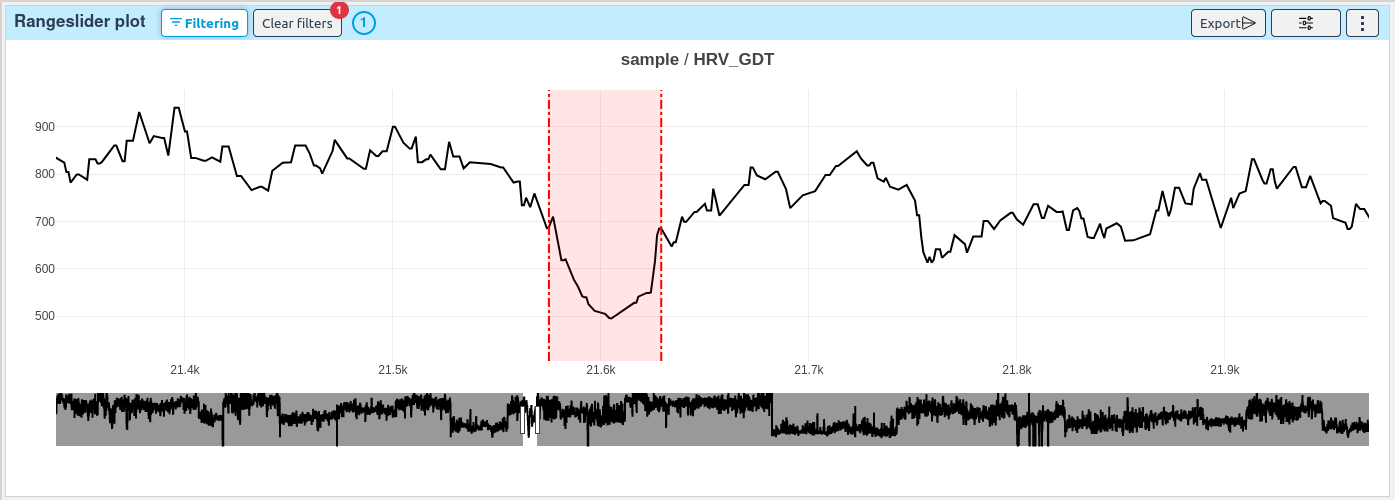
This will create a 1D selection range and update the filters and the selected samples.
# How to export the bounding range
This widget allows you to export the 1D bounding box.
Once you have drawn a selection range on the plot, you can export the data of the bounding range by clicking on the Export button on the top right side of the widget.
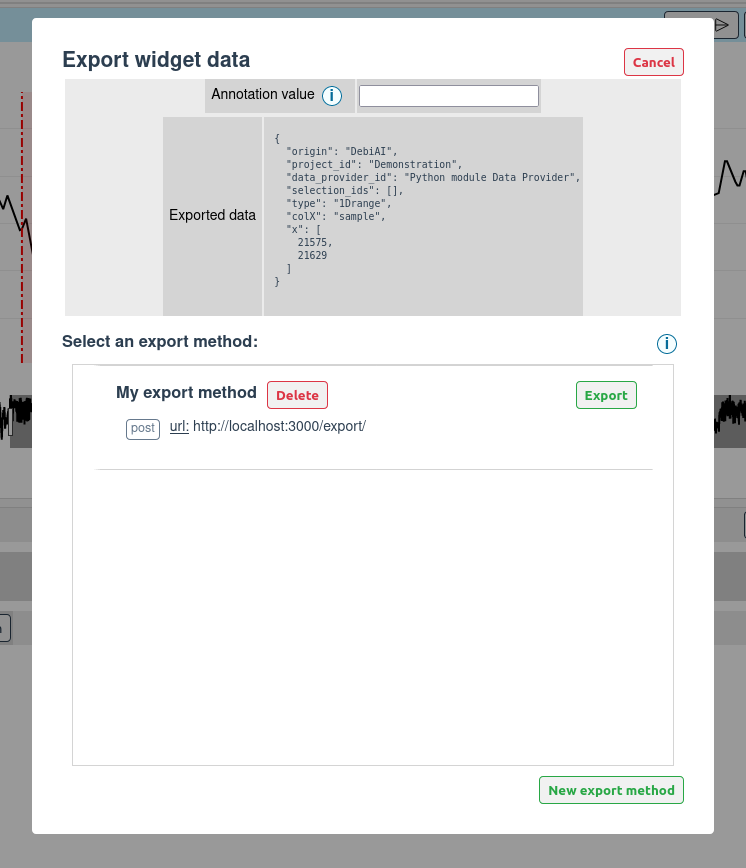
You will be prompted to choose the export method (Learn more). The export format is the following:
{
  // Generic data
  "origin": "DebiAI",
  "projectId": <Project Id>,
  "dataProviderId": <Data-provider Id>,
  "selectionIds": [<Analysis selection Ids>],

  // Widget data
  "type": "1Drange",
  "colX": <Selected X column name>,
  "x": [<X min value>, <X max value>],
}
Here is an example of the exported data:
{
  "origin": "DebiAI",
  "projectId": "Python module Data Provider",
  "dataProviderId": "Demonstration project",
  "selectionIds": [],

  "type": "1Drange",
  "colX": "sample",
  "x": [
    68596,
    68797
  ]
}
This data will be sent to the selected export method.
TIP
You can specify an optional "annotation" field in the JSON file. This field will be added to the exported JSON file.