DebiAI
Get Started
Demo (opens new window)
  • Woodscape
Contact
GitHub (opens new window)
DebiAI
Get Started
Demo (opens new window)
  • Woodscape
Contact
GitHub (opens new window)
Get Started
Demo (opens new window)
  • Woodscape
Contact
GitHub (opens new window)
  • Get started
    • Installation
  • Data insertion
    • Python module
    • Data providers
  • Custom algorithms
    • How to use algorithms
    • Integrated algorithms
    • Algo-providers
  • Dashboard
    • Widgets
      • Parallel coordinates
      • Data distribution
      • Point plot
      • 3D point plot
      • Confusion matrix
      • Correlation matrix
      • Interval plot
      • Parallel Categories
      • Range slider plot
      • Night stars plot
      • 2D density plot
      • Sample array
      • Statistics
    • Widget configurations
    • Saving layouts
    • Data export
    • Analysis export
    • Unfolding columns
  • Tutorials

    • WoodScape Tutorial

# Statistics

[Data overview] [Bias detection] [Model evaluation]

Display the average, standard deviation, and minimum and maximum values of the selected data points for a feature.

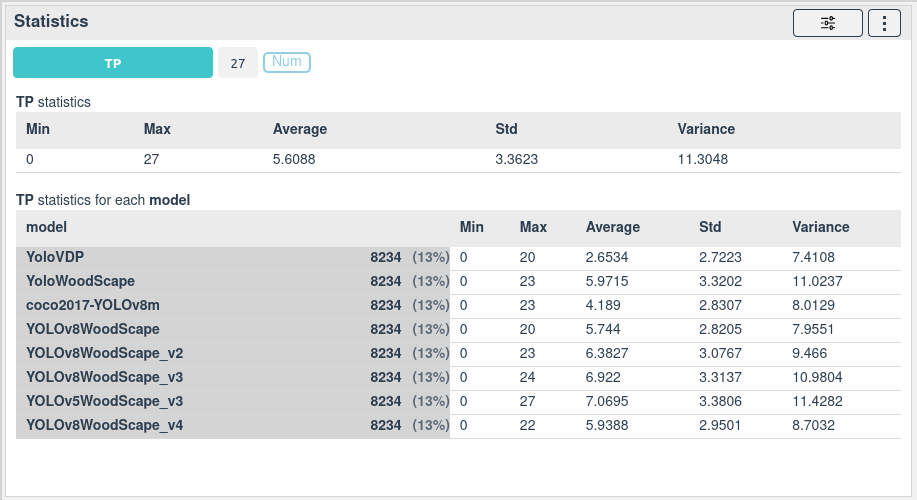
By selecting a color, you can display the statistics for each colored column unique value.

You can, for example, use this widget to display the average error for each models or for each value of a specific context.

Help us improve this page! (opens new window)

← Sample array Widget configurations →

PARTNERS
IRT SystemX Confiance AI
  • Get Started
  • Demo
  • Tutorials
  • Woodscape
  • Contact
Legal notice - Personal data and cookies All rights reserved © 2020 IRT SystemX